The following bar graph shows the number of scooters manufactured by 4 different companies, P, Q, R and S, during the years 2015 - 2017. The x - axis indicates the number of scooters manufactured and the y - axis indicates the companies. Study the bar graph carefully and answer the question that follows.
Manufacture of scooters by 4 companies
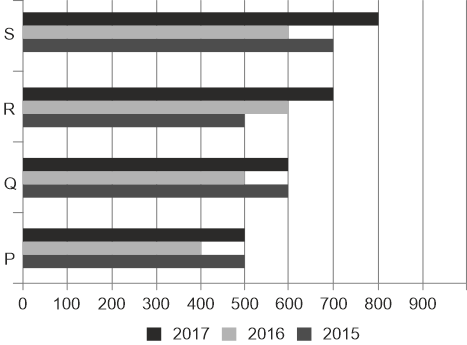
In which year(s) was the percentage increase in the manufacturing of scooters as compared to the previous years the maximum for the company R?
Show answer & explanation
Correct answer: A
Explanation
The correct answer is option 1 I.e. only 1.
Company R production:
2015: 600
2016: 650
2017: 700
Percentage increase:
2016: (650 - 600) / 600 × 100 = 8.33%
2017: (700 - 650) / 650 × 100 = 7.69%
Answer : 2016 (Maximum percentage increase)