The following bar graph represents the quantity of grains produced in a state in the years 2014, 2015 and 2016. Study the given bar graph and answer thequestion that follows.
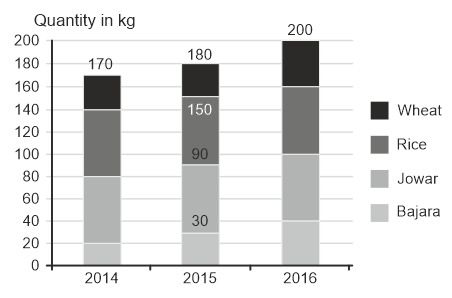
What is the difference in the percentage of wheat production in the year 2014 to the percentage of wheat production in the year 2016? (Round up to two decimal places)
Show answer & explanation
Correct answer: D
Explanation
The Solutions will be uploaded soon