The following bar graph represents the production of three types of buses by a company over the years (in thousands).
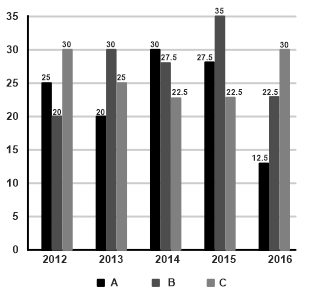
In which of the following years was the percentage production of B type buses to C type buses, the maximum?
Show answer & explanation
Correct answer: A
Explanation
The correct answer is option 1 i.e. 2015
Percentage = (Production of B type buses / Production of C type buses) x 100
Required percentage for 2013 = (30/25) × 100 = 120%
Required percentage for 2014 = (27.5/22.5) × 100 = 122.22%
Required percentage for 2015 = (35/22.5) × 100 = 155.56% (maximum)
Required percentage for 2016 = (22.5/30) × 100 = 75%
Therefore, the maximum percentage of B-type buses to C-type buses is in 2015.