The following bar graph indicates the demand and production (in hundreds) of 5 companies A, B, C, D and E. X-axis indicates the demand and production (in hundreds) and Y-axis indicates the companies. Study the bar graph carefully and answer the question that follows
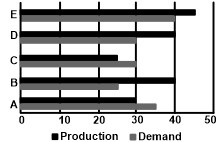
Find the difference between the average demand and average production of the five companies taken together.
Show answer & explanation
Correct answer: D
Explanation
The correct answer is option 4 i.e. 400
Average demand of the five companies taken together = = 3200
Average production of the five companies taken together = = 3600
Difference = 3600 - 3200 = 400.