The distribution of fruit consumption in a sample of 85 sixteen-year-old boys is given in the graph below. Study the graph and answer the question that follows.
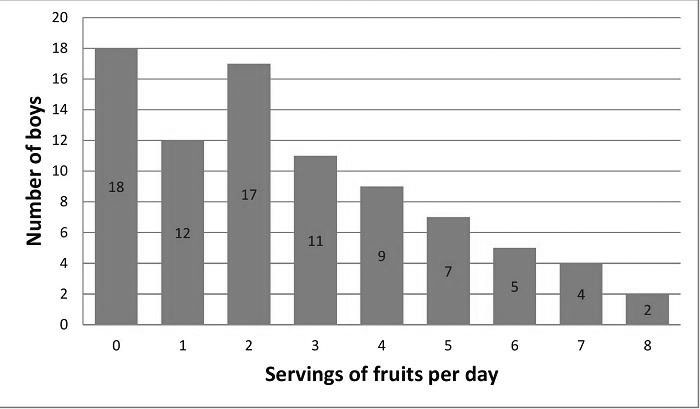
What percentage of these boys ate five or more servings per day? (Rounded off to 2 decimal places)
Show answer & explanation
Correct answer: B
Explanation
The correct answer is option 2 i.e. 21.18%.
Total number of boys = 18 + 12 + 17 + 11 + 9 + 7 + 5 + 4 + 2 = 85
Boys who ate 5 or more servings = 7 + 5 + 4 + 2 = 18
Percentage = (18 ÷ 85) × 100 = 21.176… ≈ 21.18%