The demand and production for five businesses V, W, X, Y, and Z are shown in the accompanying chart, which illustrates them using a basic bar graph to provide an answer.
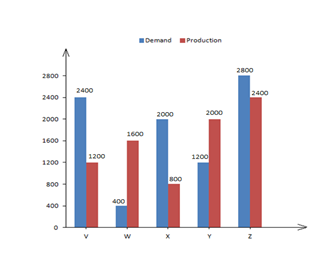
The difference between average demand and average production of the four companies (V, W, X, Y) taken together, is:
The difference between average demand and average production of the four companies (V, W, X, Y) taken together, is:
Show answer & explanation
Correct answer: A
Explanation
The Solutions will be uploaded soon