The below figure shows the estimated expenses of a family whose total estimated expenditure was Rs. 2,50,000. Study the figure and answer the question that follows.
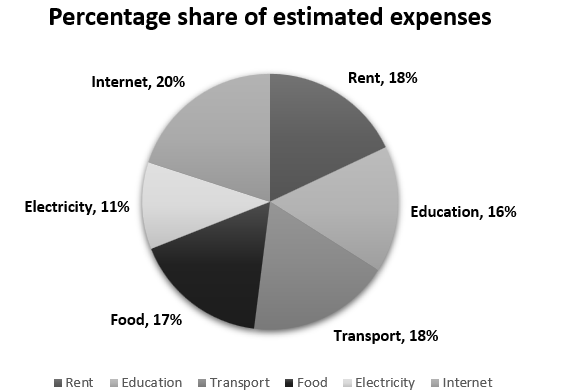
It was found that the actual expenditure on electricity was 10% more than the estimated expenditure, and the actual expenditure on rent was 20% less than estimated. All other expenses were same as that of the estimates. What was the total actual expenditure?
Show answer & explanation
Correct answer: C
Explanation
The correct answer is option 3 i.e. ₹2,43,750.
According to the given pie-chart,
Estimated expenditure on electricity = 11% of 250000
⇒ 27500
Actual expenditure on electricity = 110% of 27500
⇒ 30250
Change in expenditure on electricity = 30250 - 27500
⇒ 2750
Estimated expenditure on rent = 18% of 250000
⇒ 45000
Actual expenditure on rent = 80% of 45000
⇒ 36000
Change in expenditure on rent = 36000 - 45000
⇒ -9000
Total change in actual expenditure = -9000 + 2750
⇒ -6250
Total actual expenditure = 250000 - 6250
⇒ 243750