The bar graph shows the number of students in various classes in a school. Study the graph below and the answer the following question:
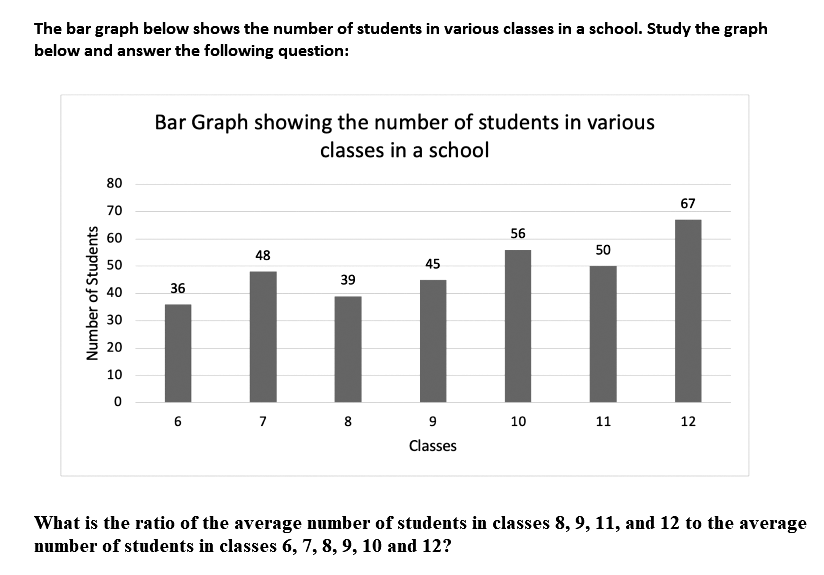
What is the ratio of the average number of studnts in classes 8, 9, 11 and 12 to the average number of students in classes 6, 7, 8, 9, 10 and 12?
Show answer & explanation
Correct answer: D
Explanation
The correct answer is option 4 i.e. 201 : 194.
Average number of students in classes 8, 9, 11 and 12 = (39 + 45 + 50 + 67)/4
⇒ 201/4
Average number of students in classes 6, 7, 8, 9, 10 and 12 = (36 + 48 + 39 + 45 + 56 + 67)/6
⇒ 291/6
Required ratio = 201/4 : 291/6
⇒ 3 × 201 = 2 × 291 = 201 : 194