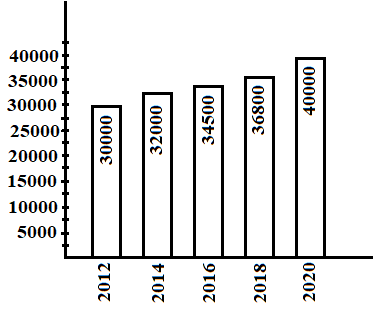
The bar graph shows the number of books published by a company in different years. In which year(s) is the number of books published more than the average number of books published in the mentioned years?
Show answer & explanation
Correct answer: B
Explanation
The correct answer is option 2, i.e., 2018 and 2020.
The number of books published in the years is:
2012 → 30,000
2014 → 32,000
2016 → 34,500
2018 → 36,800
2020 → 40,000
Average = (30000 + 32000 + 34500 + 36800 + 40000) ÷ 5
= 173,300 ÷ 5 = 34,660
Compare each year with the average:
2012 → 30,000 < 34,660 → below average
2014 → 32,000 < 34,660 → below average
2016 → 34,500 < 34,660 → below average
2018 → 36,800 > 34,660 → above average
2020 → 40,000 > 34,660 → above average
= 2018 and 2020