The bar graph shows the exports of cars of type A and B (in Rsmillions).
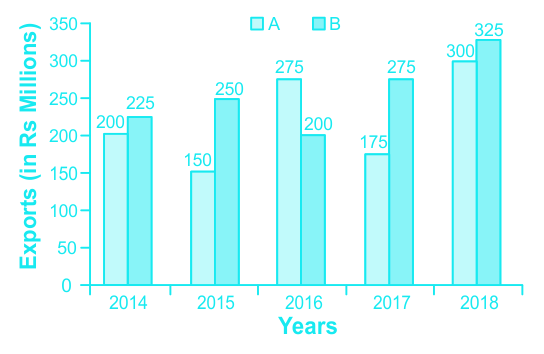
The total export of cars of type A in 2014 to 2017 is approximately what percentage less than the total exports of cars of type B in 2015 to 2018?
Show answer & explanation
Correct answer: D
Explanation
The correct answer is option 4 ie 23.8
Exports of A (2014 to 2017) = 800
Exports of B (2015 to 2018) = 1050
% decrease = (250 / 1050) × 100
= 23.8%