The bar graph shows the exports of Cars of type A and B (in Rs. million).
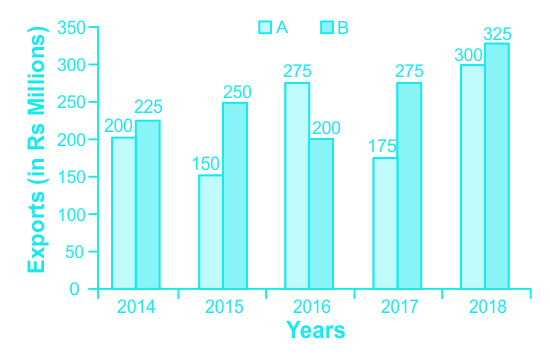
In which year the exports of car of type A was around 10% less than the average exports (per year) of cars of type B over the 5 years?
Show answer & explanation
Correct answer: C
Explanation
The correct answer is option 3 ie 2014.
The question has been modified since it was incorrect accorrding to the answer key released by the SSC.
Average of type A = 1100/5 = 220
Around 10% less
220 - (10 / 100) × 220 = 220 - 22
= 198
In the year 2014, the export was 200 which is around 10% less than the average exports.