The bar graph given here showns the data of the production of cars by three diferent companies X, Y, Z over the years.
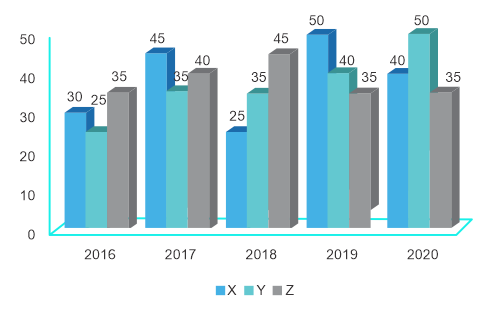
For which of the following years is the percentage rise/fall in the production from the previous years the maximum for company Y?
Show answer & explanation
Correct answer: D
Explanation
The correct answer is option 4 i.e. 2017.
According to the question
The percentage rise/fall in production from the previous year the maximum for company Y
In 2019, = [(40 - 35) /35] * 100 = 14.28%
In 2018, = [(35 -35)/35)]*100 = 0
In 2017, = [(35 - 25)/25] *100 =40%
Hence, 2017 is the correct answer