The bar graph given below shows the sales of books (in thousands) from five branches of a publishing company during two consecutive years 2015 and 2016.
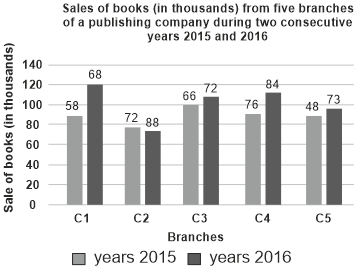
What percentage (rounded off to 2 decimal places) of the average sales of branches C1, C3 and C5 in 2016 is the average sales of branches C1, C2, C3 and C4 in 2015?
Show answer & explanation
Correct answer: C
Explanation
The correct answer is option 3 i.e. 81.21%.
According to the given graph,
Total sales of branches C1, C2, C3 and C4 in 2015 = 85 + 78 + 100 + 90 = 353
Average sales of branches C1, C2, C3 and C4 in 2015 = 353/4 = 88.25
Total sales of branches C1, C3 and C5 in 2016 = 120 + 110 + 96 = 326
Average sales of branches C1, C3 and C5 in 2016 = 326/3 = 108.67
Required percentage = (88.25/108.67) × 100
⇒ 81.209 ≈ 81.21%