The bar graph given below shows the number of cars produced in the given 5 years.
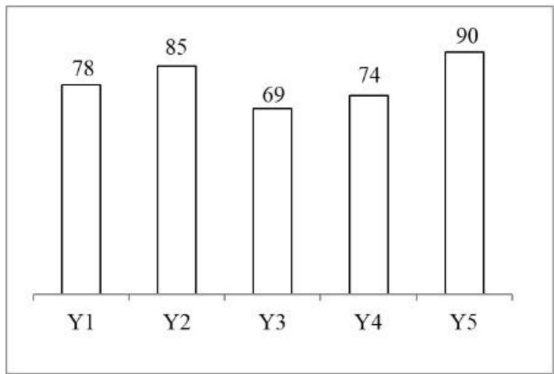
Number of cars produced in Y4 are what percent more than number of cars produced in Y3?
Show answer & explanation
Correct answer: C
Explanation
Given:
Y3 = 69, Y4 = 74
According to the formula:
Percentage = (Difference / Y3) × 100
Difference = 74 − 69 = 5
Percentage = (5 / 69) × 100 = 7.25%