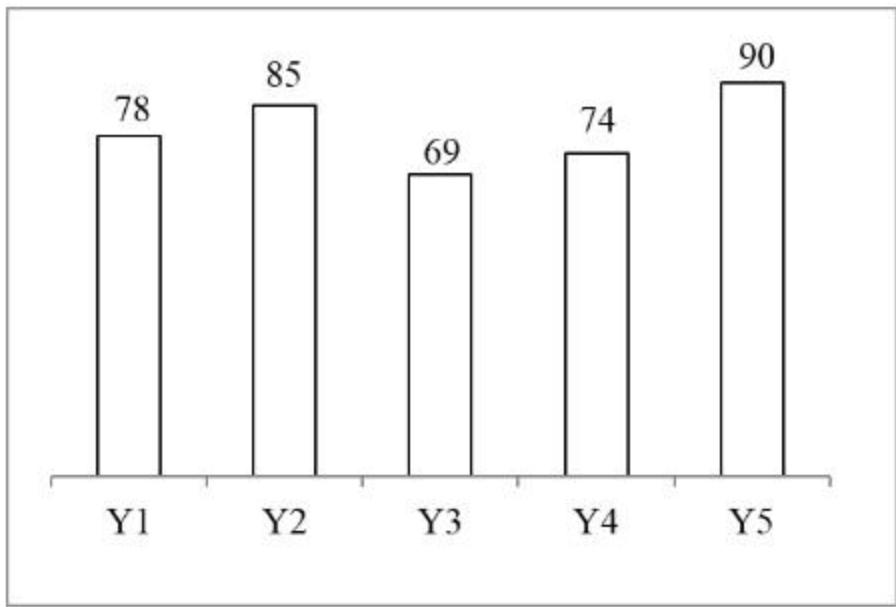
The bar graph given below shows the number of cars produced in the given 5 years.
R = Average number of cars produced in the given 5 years
A = Total number of cars produced in Y2, Y3 and Y4.
What is the value of A - R?
Show answer & explanation
Correct answer: C
Explanation
Y1 = 78, Y2 = 85, Y3 = 69, Y4 = 74, Y5 = 90
Total = 78 + 85 + 69 + 74 + 90 = 396
R = 396 / 5 = 79.2
A = 85 + 69 + 74 = 228
A − R = 228 − 79.2 = 148.8