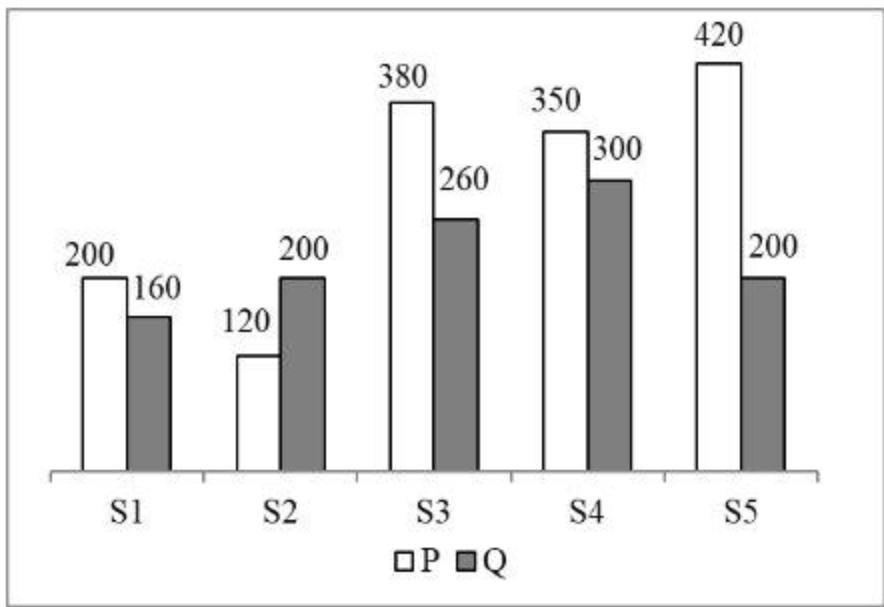
The bar graph given below shows the number of male voters (P) and female voters (Q) in 5 states.
Which of the following statement is correct?
I. In state S2, female voters are 80 more than male voters.
II. In state S4, male voters are 50 more than female voters.
Show answer & explanation
Correct answer: C
Explanation
Given:
In S2: P = 120, Q = 200
In S4: P = 350, Q = 300
According to the formula:
Difference = Larger Value − Smaller Value
Calculation:
I. Difference in S2 = 200 − 120 = 80
II. Difference in S4 = 350 − 300 = 50
Both I and II are correct.