The bar graph given below shows the data of the production of paper (in lakh tonnes) by three different companies P. Q and R over the years.
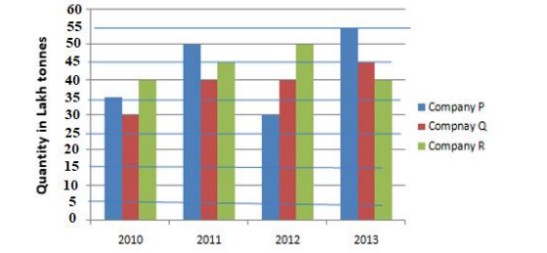
What is the percentage increase in the productionby company Q from 2010 to 2013?
Show answer & explanation
Correct answer: D
Explanation
The correct answer is option 4 i.e. 50%.
% increase = (45 - 30)/30 x 100 = 50%