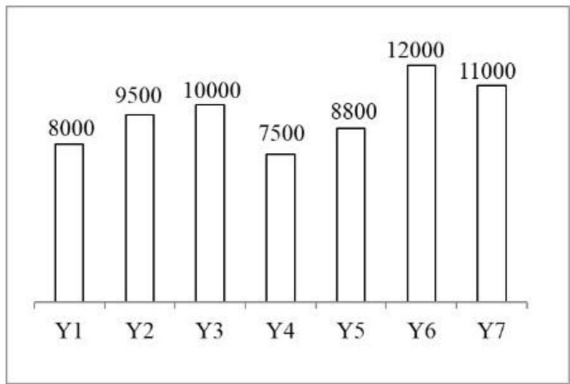
The bar graph given below shows runs scored by a batsman in the given 7 years.
Average runs scored by batsman in year Y3, Y6 and Y7 is equal to runs scored by the batsman in which year?
Show answer & explanation
Correct answer: B
Explanation
Y1 = 8000
Y2 = 9500
Y3 = 10000
Y4 = 7500
Y5 = 8800
Y6 = 12000
Y7 = 11000
Average = (Y3 + Y6 + Y7) / 3
= (10000 + 12000 + 11000) / 3 = 11000
In which year were 11,000 runs scored? = Y7