The bar chart given below shows the ratio of expenditure to revenue for seven consecutive years Y1, Y2, Y3, Y4, Y5, Y6 and Y7.
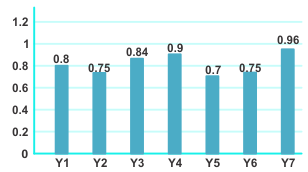
The profit percentage is lowest for which year?
Show answer & explanation
Correct answer: B
Explanation
The correct answer is option 2 i.e. Y7.
| Understanding/Application |
|
Profit = Revenue - Expenditure Profit% = (Profit × 100)/Revenue |
|
For Y3 - Expenditure/Revenue = 0.84 = 84/100 Let expenditure = 84x and revenue = 100x. Profit% = [(100x - 84x) × 100x]/100 = 16% For Y4 - Profit% = [(100x - 90x) × 100x]/100 = 10% For Y7 - Profit% = [(100x - 96x) × 100x]/100 = 4% |