Study the given table and answer the question that follows.
The table shows the annual consumption (in hundred tonnes) of tea in five states (A, B, C, D and E) across six years (2014 to 2019).
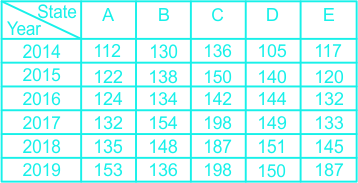
The consumption of tea in which state and year is closest to the average consumption of tea in State A over six years?
Show answer & explanation
Correct answer: B
Explanation
The correct answer is option 2 i.e. B in 2014
Average consumption = Sum of the consumption ÷ No of years
The average Consumption of tea of state A over 6 years = (112 + 122 + 124 + 132 + 135 + 153) ÷ 6
⇒ 778 ÷ 6 = 129.67 (Hundred tones)
Going by the options:
Consumption of the state C in 2016 = 142 (Hundred tones)
Consumption of the state B in 2014 = 130 (Hundred tones)
Consumption of the state E in 2019 = 187 (Hundred tones)
Consumption of the state D in 2018 = 151 (Hundred tones)