Study the given pie chart and answer the questions that follow.
The pie chart shows the data for A, B, O, and AB blood groups of 240 donors.
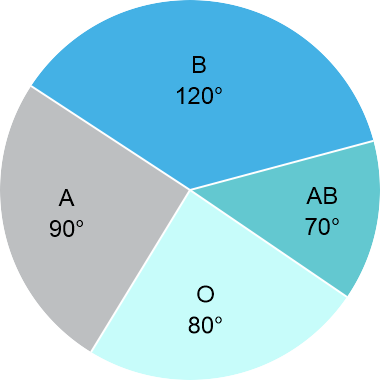
The ratio of the donors of blood group O to the average of the donors of groups A and AB is:
Show answer & explanation
Correct answer: B
Explanation
The correct answer is option 2 i.e. 1:1