Study the given pie chart and answer the question that follows.
The pie chart shows the distribution (degree-wise) of the students who appeared in the annual examination from institutes P, Q, R, S, and T in 2020. The total number of students who appeared is 3000.
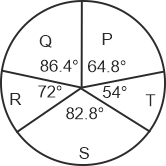
The average number of students who appeared in the examination from the institutes Q, S, and T exceeds the number of students who appeared from institute R by x. The value of x lies between:
Show answer & explanation
Correct answer: B
Explanation
The correct answer is option 2 i.e. 18 to 22.
Total angle occupied by the institute Q, S, and T = 86.4° + 82.8° + 54° = 223.2°
The average number of students who appeared in the examination from the institutes Q, S, and T = [(223.2/360) × 3000]/3
= 1860/3
= 620
Number of students who appeared from the institute R = (72/360) × 3000 = 600
x = 620 - 600 = 20 [Between 18 and 22]