Study the given pie chart and answer the question that follows.
The pie chart shows the distribution (degree wise) of the number of computers sold by a shopkeeper during five months.
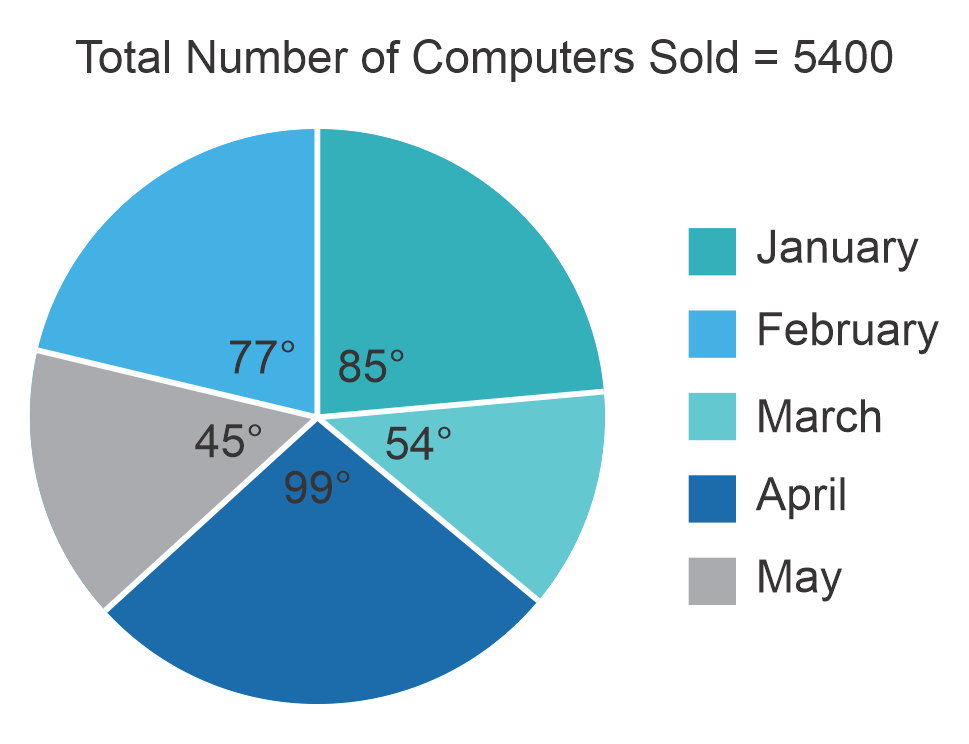
By what percentage is the total number of computers sold in April and May more than the number of computers sold in January and March (correct to one decimal place)?
Show answer & explanation
Correct answer: B
Explanation
The correct answer is option 2 i.e. 9.9%
Explanation:
According to the given chart,
The total number of computers sold in April and May = = = 2160
The number of computers sold in January and March = = = 1965
Now the difference = 2160 - 1965 = 195
So, the required percentage = = 9.9%
Hence the required answer is 9.9%.