Study the given graph which shows the Target and production of AC's (in thousands) of a factory over five months and answer the question that follows.
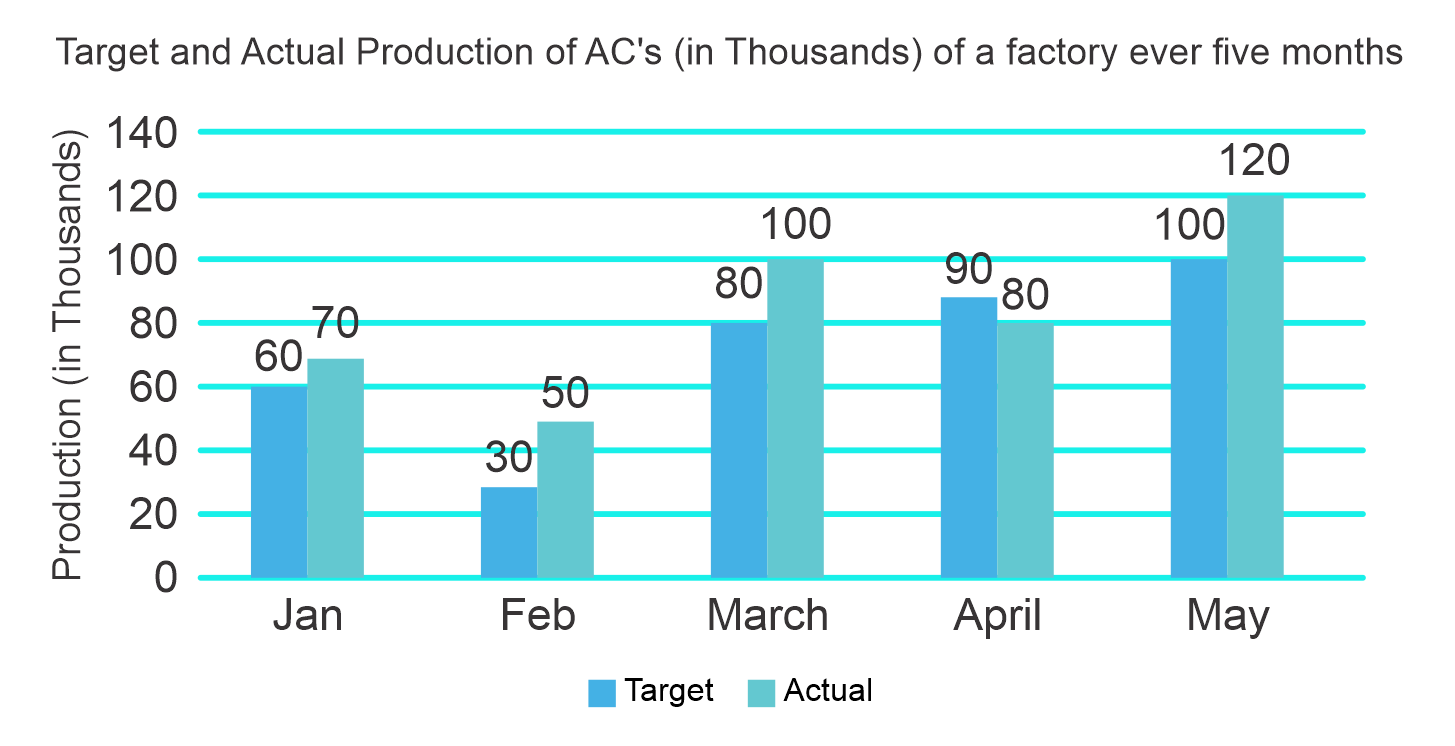
The ratio of the combined target production of AC's from January to April to that of the Actual production of AC's from March to May is:
Show answer & explanation
Correct answer: D
Explanation
The correct answer is Option 4 i.e. 13 : 15.
Explanation:
According to the given chart,
Combined target production of AC's from January to April = (60 + 30 + 80 + 90) = 260
Also, the Actual production of AC's from March to May = (100 + 80 + 120) = 300
Now, the required ratio = 260 : 300 = 13 : 15
Hence the required answer is 13 : 15.