Study the given graph carefully and answer the question that follows.
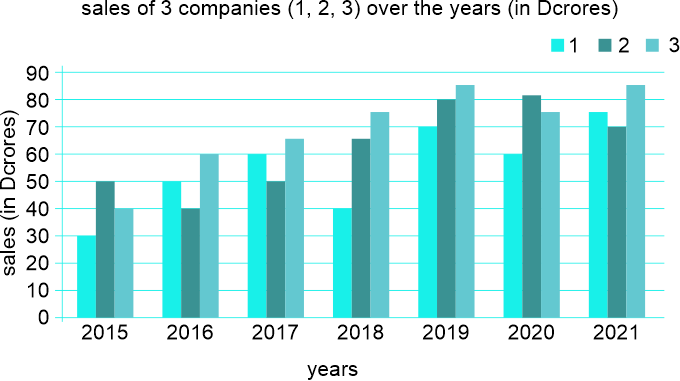
In which of the following years was the sales of company I exactly half of the total sales of companies 2 and 3 together in that year?
Show answer & explanation
Correct answer: C
Explanation
The correct answer is option 3 i.e. 2016
We can see from the graph that the sales of company 1 in 2016 = 50
Sales of company 2 in 2016 = 40
Sales of company 3 in 2016 = 60
Thus, 2016 is such an year where the sales of company 1 is half of the total sales of company 2 and 3.