Study the given graph carefully and answer the question that follows. The graph shows the demand and production of different companies.
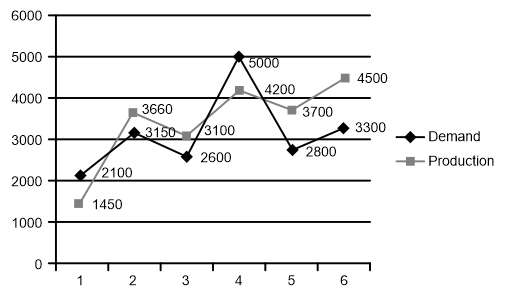
Lowest production is what percentage of the highest demand?
Show answer & explanation
Correct answer: C
Explanation
The correct answer is option 3 i.e. 29%.
According to the givne graph,
Lowest production = 1450
Highest demand = 5000
Required percentage = = 29%