Study the given graph and answer the question that follows.
The graph shows the exports from three companies (A, B and C) over the years (in Rs. Crore)
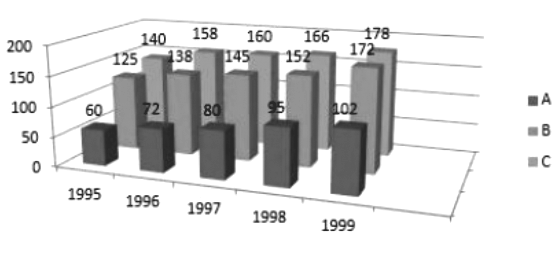
In which year was the difference between the exports from companies A and B the minimum?
Show answer & explanation
Correct answer: B
Explanation
The correct answer is option 2 i.e. 1998.
Difference between the exports from companies A and B:-
1995 → 125 - 60 = 65
1996 → 138 - 72 = 66
1997 → 145 - 80 = 65
1998 → 152 - 95 = 57
1999 → 172 - 102 = 70
Hence, in 1998 the difference between the exports from companies A and B was the minimum.