Study the given graph and answer the question that follows.
The graph shows the exports from three companies (A, B and C) over the years (in ₹ crore).
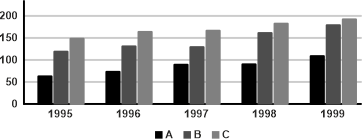
In how many given years were the exports from company C less than the average annual exports over the given years?
Show answer & explanation
Correct answer: B
Explanation
The correct answer is option 2 i.e. 3.
Sum of exports of company C = 140 + 158 + 160 + 166 + 178 = 802 crore
Average = 802 / 5 = 160.4 crore
Years where exports were less than average: 1995, 1996, 1997
Hence, the exports from company C are less than the average annual exports for 3 years.