Study the given graph and answer the question that follows.
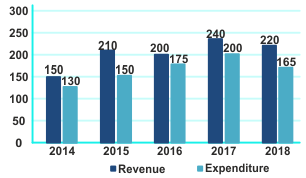
In which year was the revenue 33% more than the average expenditure of the company during 2014 to 2018?
Show answer & explanation
Correct answer: C
Explanation
The correct answer is option 3 i.e. 2018
Concept
Sum of observation / No. of observation
Application
Average expenditure of the company from 2014 to 2019 = (130 + 150 + 175 + 200 + 165 + 170) / 6 = 165
According to the question
= 165 × 4/3 = 220
2018 year has the 220 as its revenue