Study the given graph and answer the question that follows.
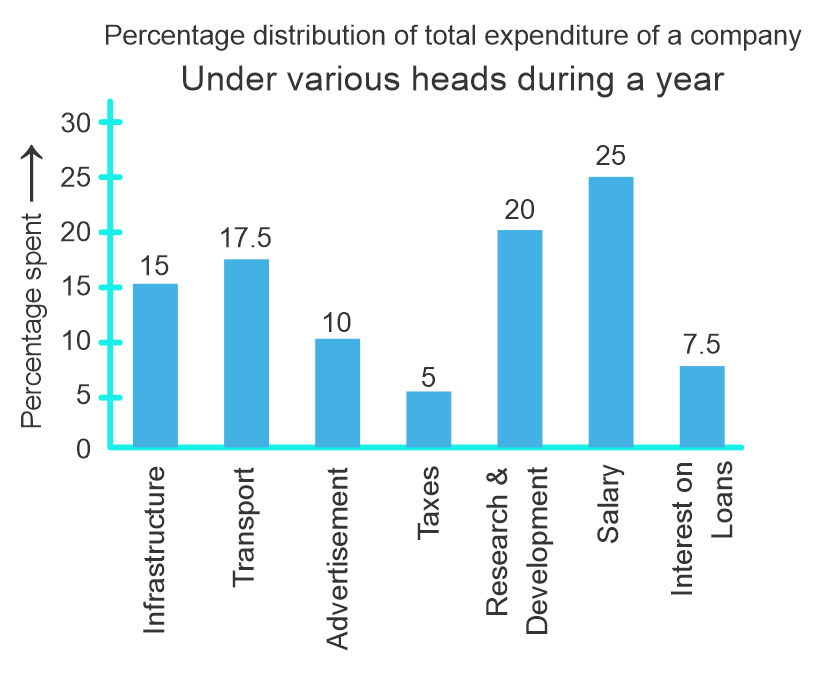
The bar graph shows the percentage distribution of total expenditure of a company under various expense heads during a year.
The total expenditure of the company in the year is how many times the expenditure on research & Development?
Show answer & explanation
Correct answer: A
Explanation
The correct answer is Option 1 i.e. 5.
Given that
The expenditure of research and development = 20
Total expenditure of company = 15 + 17.5 + 10 + 5 + 20 + 25 + 7.5 = 100
According to the question
Total expenditure of company = 100/20 = 5 times the expenditure of research and development