Study the given graph and answer the question that follows.
The bar graph shows the exports of cars of Type A and B (in millions) from 2014 to 2018.
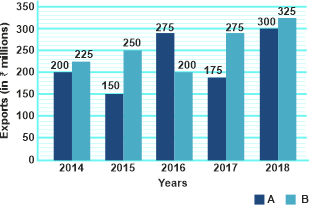
In which year were the exports of cars of type B Rs 20 millions less than the average exports (per year) of cars of type A over the five years?
Show answer & explanation
Correct answer: A
Explanation
The correct answer is option 1 i.e. 2016
Average exports of car of type A = 200 + 150 + 275 + 175 + 300 / 5 = 220 millions
The exports of car B in year 2016 = 200 millions
220 - 20 = 200 millions.