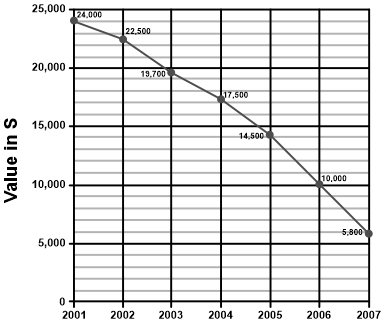
Study the given graph and answer the question that follows.The graph represents the depreciation of a car from 2001 to 2007.
What is the depreciation of the car from 2001 to 2007 in percentage?
Show answer & explanation
Correct answer: C
Explanation
The correct answer is option 3 i.e. 75.83%.
Value of car in 2001 = 24000
Value of car in 2007 = 5800
Required depreciation = ((24000 - 5800)/24000) × 100
⇒ 75.83%