Study the given graph and answer the question that follows.
The graph shows the data of the number of accidents by three types of vehicles: X, Y and Z in four cities: P, Q, R and S.
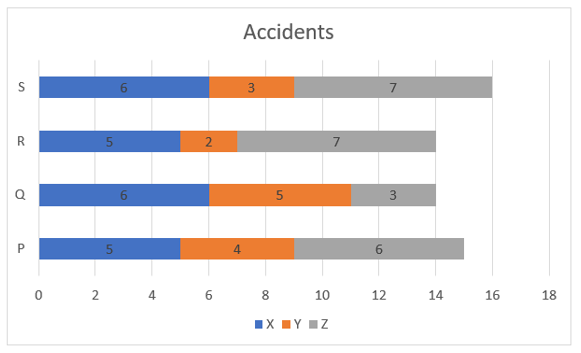
The maximum number of accidents in all cities are due to vehicles of type:
The graph shows the data of the number of accidents by three types of vehicles: X, Y and Z in four cities: P, Q, R and S.
The maximum number of accidents in all cities are due to vehicles of type:
Show answer & explanation
Correct answer: D
Explanation
The Solutions will be uploaded soon