Study the given graph and answer the question that follows.
The graph shows the data of production of items: W, R and T by four companies: S, D, F and G as percentage of their total productions.
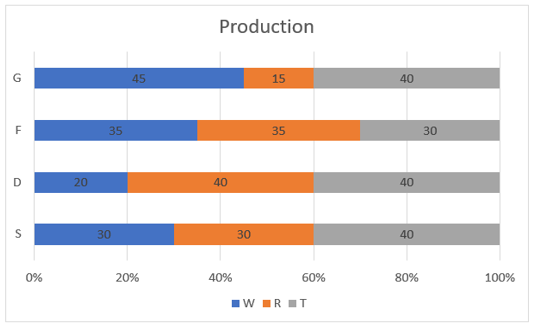
If the total productions of F and S are 2000 and 3000, respectively, the difference in the productions of R by these companies is:
The graph shows the data of production of items: W, R and T by four companies: S, D, F and G as percentage of their total productions.
If the total productions of F and S are 2000 and 3000, respectively, the difference in the productions of R by these companies is:
Show answer & explanation
Correct answer: A
Explanation
The Solutions will be uploaded soon