Study the given bar graph carefully and answer the question that follows.
The bar graph given below gives the data of production of paper (in lakh tonnes) by 3 different companies X, Y and Z over the years 2015 to 2018.
Production of Paper (in lakh tonnes)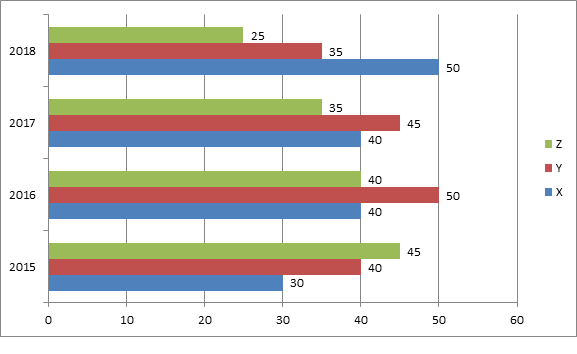 In which year was the percentage of production of company Y to the production of company Z the maximum?
The bar graph given below gives the data of production of paper (in lakh tonnes) by 3 different companies X, Y and Z over the years 2015 to 2018.
Production of Paper (in lakh tonnes)
Show answer & explanation
Correct answer: A
Explanation
The Solutions will be uploaded soon