Study the given bar graph and answer the question that follows.
The bar graph shows the number of students enrolled in Institutes A and B during 5 years (2014 to 2018).
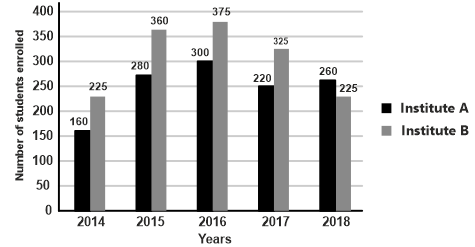
If the students of Institute A for each year are represented on a pie chart, then the angle corresponding to year 2016 will be:
Show answer & explanation
Correct answer: A
Explanation
The correct answer is option 1 i.e. 86.4°.
Total students from institute A = 160 + 280 + 300 + 250 + 260 = 1250
Pie chart angle for 2016 = × 360 = 86.4°