Study the given bar graph and answer the question that follows.
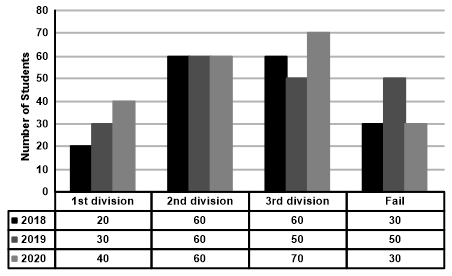
The following bar graph shows the higher secondary students of a school for years 2018, 2019, and 2020.
What was the percentage of students who passed in the first division in 2019?
Show answer & explanation
Correct answer: B
Explanation
The correct answer is option 2 i.r.
Total number of students in 2019 = 30 + 60 + 50 + 50 = 190
Number of students in 1st division = 30
Required percentage = (30/190) × 100 = (300/19)% = %
Therefore, the percentage of students who passed in the first division in 2019 is %.