Study the given bar graph and answer the following.
The given bar graph reresent the Sales turnover (in crore Rs.) of five automobile companies A, B, C, D and E during 2014-2015 and 2015-2016. The X - axis represent the copanies and Y-axis shows Sales turnover (in crore Rs.)
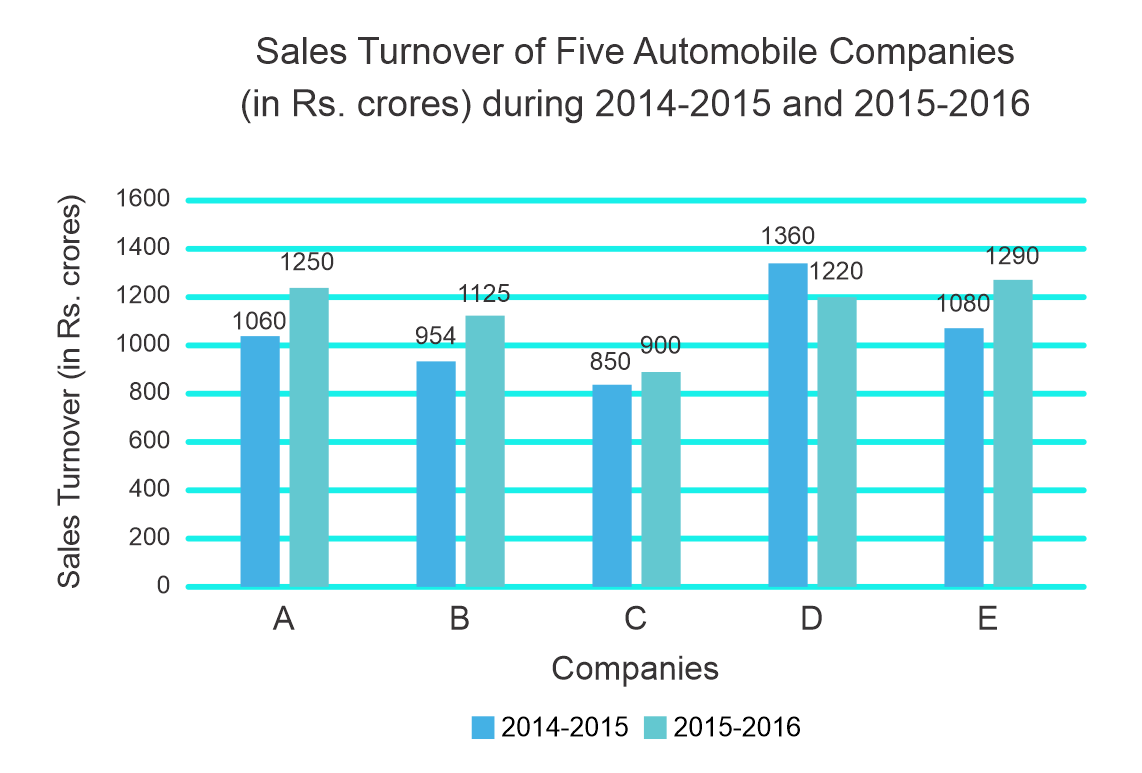
What should have been the sales turnover (in crore Rs.) of Company C in 2015-2016 to have shown the same increase in sales over 2014-2015 as shown by sales turnover (in crore Rs.) of Company E?
Show answer & explanation
Correct answer: B
Explanation
The correct answer is option 2 i.e. 1060
According to the question
The sales turnover (in crore Rs.) of Company E in 2015-2016 = 1290
The increase in sales over 2014-2015 of Company E = 1290 - 1080 = 210
Now, the sales turnover (in crore Rs.) of Company C in 2015-2016 = 850 + 210 =1060