Study the given Bar Graph and answer the question that follows.
The given Bar Graph shows the exports and imports (in crores of rupees) of five companies in a particular financial year.
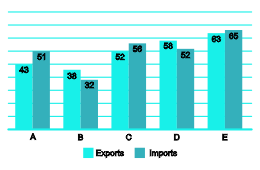
Based on the given information, the ratio of exports to imports is highest in company ______.
Show answer & explanation
Correct answer: C
Explanation
The correct answer is option 3 i.e. B
Calculations:
The exports to imports ratios for company A = 43/51 = 0.84
The exports to imports ratios for company B = 38/32 = 1.18
The exports to imports ratios for company C = 52/56 = 0.92
The exports to imports ratios for company D = 58/52 = 1.11
The exports to imports ratios for company E = 63/65 = 0.96
Hence, the ratio of exports to imports is highest in company B.