Study the given bar graph and answer the question that follows.
The given bar graph shows the sale of toys (in thousands) from five branches of a manufacturer for two consecutive years, 2021 and 2022.
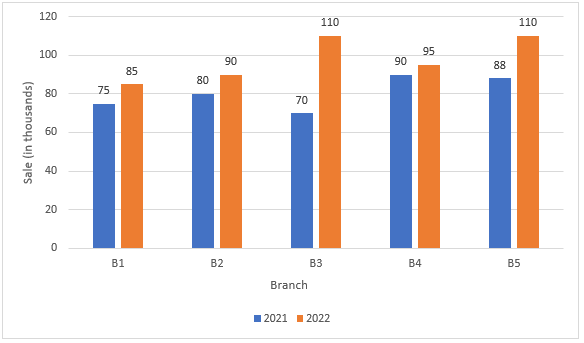
What is the difference between the average sales (in thousands) of all the five branches in 2021 and 2022?
The given bar graph shows the sale of toys (in thousands) from five branches of a manufacturer for two consecutive years, 2021 and 2022.
What is the difference between the average sales (in thousands) of all the five branches in 2021 and 2022?
Show answer & explanation
Correct answer: D
Explanation
The Solutions will be uploaded soon