Study the given bar graph and answer the question that follows.
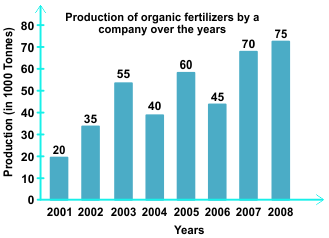
The average production in 2002 and 2003 was exactly equal to the average production in which of the following pairs of years?
Show answer & explanation
Correct answer: B
Explanation
The correct answer is option 2 i.e. 2001 and 2007
Average Production = Sum of the production ÷ No of years
The average production of the years 2002 & 2003 = (35 + 55)/2 = 45 (10000 tonnes)
The average production of the years 2004 & 2006 = (40 + 45)/2 = 42.5 (10000 tonnes)
The average production of the years 2001 & 2007 = (20 + 70)/2 = 45 (10000 tonnes)
The average production of the years 2004 & 2007 = (40 + 70)/2 = 55 (10000 tonnes)
The average production of the years 2006 & 2008 = (45 + 75)/2 = 60 (10000 tonnes)