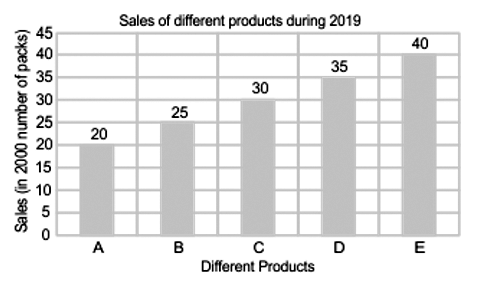
Study the given bar graph and answer the question that follows. A company provides five different products. The sales of these five products (in 1000 number of packs) during 2019 are shown in the bar-graph.
Sales of different products during 2019
Sales (in 1000 number of packs)
What is the approximate ratio of sales of product A to product E in 2019?
Show answer & explanation
Correct answer: A
Explanation
The correct answer is option 1 i.e. 1 : 2.
Given that
The sales of product A in 2019 = 20 thousand
The sales of product E in 2019 = 40 thousand
Hence, the required ratio of sales = 20/40 = 1/2 i.e. 1 : 2