Study the given bar-graph and answer the question that follows.
The bar-graph shows the production (in lakh) of kitchen appliances manufactured by three companies A, B, and C over a period of six years from 2012 to 2017.
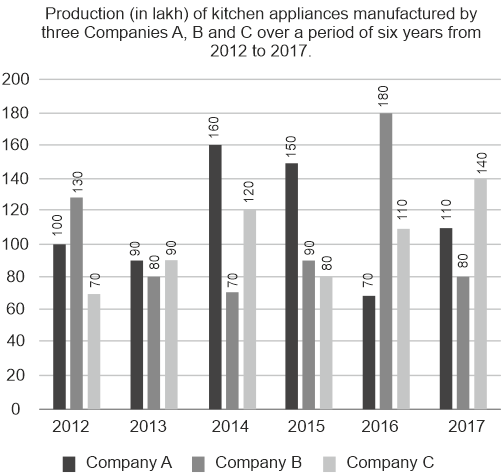
What is the difference (in lakh) between the average production of company B during the period 2012 to 2017 and the combined average of the production of company A in 2012, 2014, 2015 and the production of company C in 2014, 2016, and 2017, respectively?
Show answer & explanation
Correct answer: A
Explanation
The correct answer is option 1 i.e. 25.
The average production of company B during the period 2012 to 2017 = (130 + 80 + 70 + 90 + 180 + 80)/6
= 630/6 = 105
The production of company A in 2012, 2014, 2015 = 100 + 160 + 150 = 410
The production of company C in 2014, 2016, 2017 = 120 + 110 + 140 = 370
the combined average of the production of company A and C = (410 + 370)/6 = 780/6 = 130
Required difference = 130 - 105 = 25