Study the given bar graph and answer the question that follows.
The given bar graph shows the number of students enrolled in institutes A and B during 5 years (2018 to 2022).
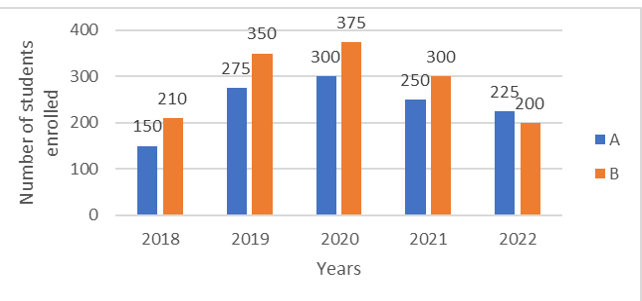
What is the percentage of the total students enrolled in institute A in year 2019 and 2020 to that of the total students enrolled in institute B? (Correct to one decimal place)
The given bar graph shows the number of students enrolled in institutes A and B during 5 years (2018 to 2022).
What is the percentage of the total students enrolled in institute A in year 2019 and 2020 to that of the total students enrolled in institute B? (Correct to one decimal place)
Show answer & explanation
Correct answer: B
Explanation
The Solutions will be uploaded soon