Study the given bar-graph and answer the question that follows. The bar-graph shows the number of shirts manufactured (in thousands) by a company during five years.
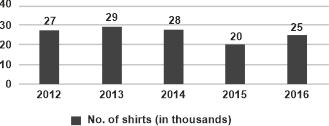
What is the percentage decrement in the production of shirts in the year 2015 as compared to 2014 (correct up to two decimals)?
Show answer & explanation
Correct answer: A
Explanation
The correct answer is option 1 i.e. 28.57%.
Percentage = [(28 - 20)/28] × 100 = (8/28) × 100 = 28.57% (approx)