Study the given bar graph and answer the question that follows.
The bar graph shows the exports and imports (in lakhs) of a company from 2000-2004.
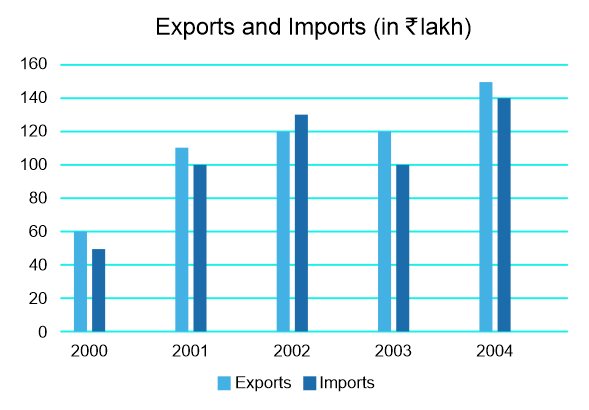
What is the average export (in lakhs) from the year 2000 to 2004?
Show answer & explanation
Correct answer: C
Explanation
The correct answer is option 3 i.e. 112
The average export (in lakhs) from the year 2000 to 2004
= [60 + 110 + 120 + 120 + 150]/5 = 560/5 = 112