Study the given bar-graph and answer the question that follows.
The bar-graph shows the production (in lakh) of kitchen appliances manufactured by three companies A, B, and C over a period of six years from 2012 to 2017.
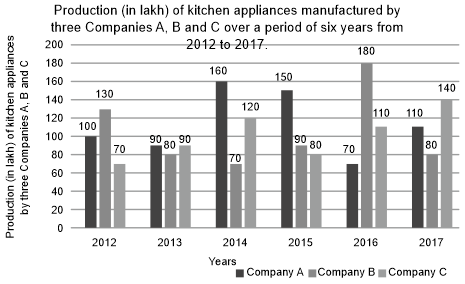
In which year was the percentage of rise / fall in production from the previous year the maximum for company C?
Show answer & explanation
Correct answer: C
Explanation
The correct answer is option 3 i.e. 2016.
Percentage of rise / fall in production of company C from 2012 to 2013 = 28.57%
Percentageof rise / fall in production of company C from 2013 to 2014 = 33.33%
Percentage of rise / fall in productionof company C from 2014 to 2015 = 33.33%
Percentage of rise / fall in production of company C from 2015 to 2016 = 37.5%
Percentage of rise / fall in production of company C from 2016 to 2017 = 27.27%
In 2016 the percentage of rise / fall in production from the previous year the maximum for company C.