Study the given bar graph and answer the question.
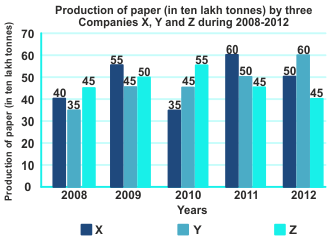
The bar graph given below represents the data of the Production of Paper (in ten lakh tonnes) by three different companies X, Y and Z during the years 2008 to 2012. The x - axis shows the Years and the y - axis represents the Production of Paper ( in ten lakh tonnes).
(Note: The data shown below is only for mathematical exercise. They do not represent the actual figures.)
Which company/companies had the maximum average production for the given five years period?
Show answer & explanation
Correct answer: B
Explanation
The correct answer is option 2 i.e. X and Z both.
Production of company X = 40 + 55 + 35 + 60 + 50
⇒ 240
Production of company Y = 35 + 45 + 45 + 50 + 60
⇒ 235
Production of company Z = 45 + 50 + 55 + 45 + 45
⇒ 240
X and Z both are maximum.