Study the following graph which shows imports and exports (in 7 crores) of a company during 2006-07 to 2010-11 and answer the question.
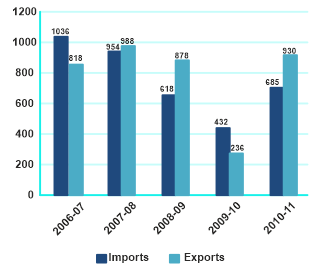
In which of the following was (Imports-Exports) minimum?
Show answer & explanation
Correct answer: B
Explanation
The correct answer is option 2 i.e. 2009-10
Explanation:
According to the given graph,
The import-export during 2006-07 = 1036 + 818 =1854
The import-export during 2007-08 = 954 + 988 = 1942
The import-export during 2008-09 = 618 + 878 = 1496
The import-export during 2009-10 = 432 + 236 = 668
The import-export during 2010-11 = 685 + 930 = 1615
The year in which import-export is minimum = 2009-10
Hence the required answer is 2009-10.