Study the following graph carefully and answer the question given below it.
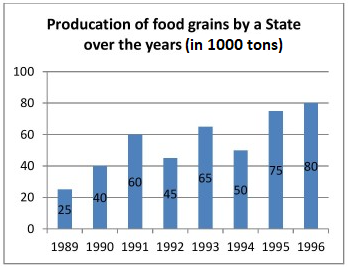
In which of the following years was the percentage increase in production from the previous year the maximum among the given years?
Show answer & explanation
Correct answer: B
Explanation
The correct answer is option 2 i.e. 1990.
From the graph:
1989: 25
1990: 40 → ((40−25)/25)×100 = 60%
1991: 60 → 50%
1992: 45 → -25%
1993: 65 → 44.4%
1994: 50 → -23%
1995: 75 → 50%
1996: 80 → 6.7%
Max % increase = 60% in 1990